Projects Flagship
Quant Research Studio
A visual studio for building and testing trading strategies where reproducibility comes first: every strategy compiles to deterministic, readable Python, and every result can be traced back to the code that produced it.
- Status
- Working prototype
- Built with
- Python
- React
- FastAPI
- NautilusTrader
- Source
- Private repository
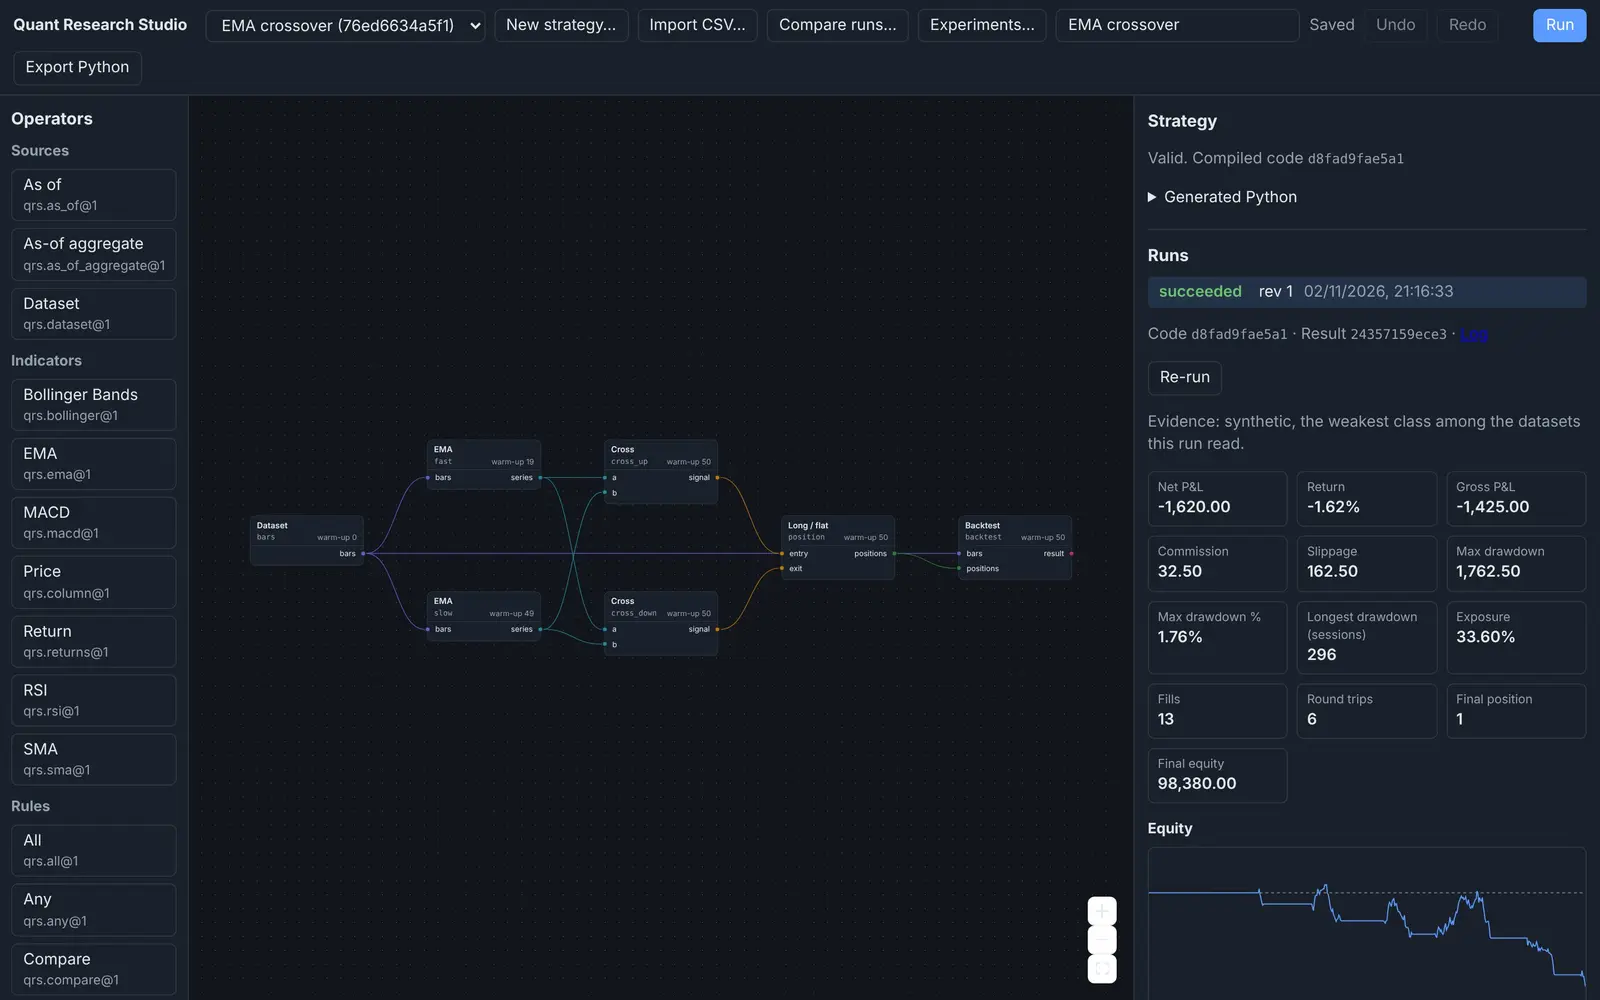
The problem
Backtests are easy to make persuasive and hard to trust. A signal can quietly use data that would not have been available at the time, a script can change between runs, and a good-looking result can be impossible to reproduce a week later.
Quant Research Studio treats those as engineering problems: make the strategy an explicit artefact, make its execution deterministic, and test the operators for the leaks that research mistakes are made of.
What it does
Strategies are graphs of registered, versioned operators — sources, indicators, rules, positions and backtests — connected in a React editor. A validated graph compiles to a Python module, which a worker runs against versioned datasets using NautilusTrader for the simulation. Results are stored with their provenance, and the same compiled code can be exported as a standalone Python bundle.
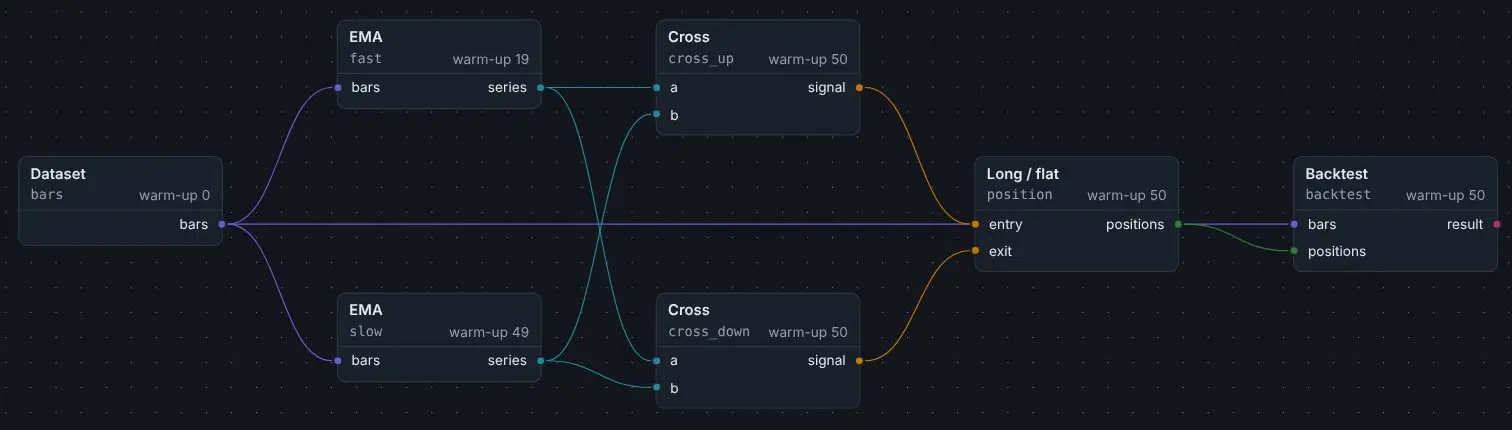
Reproducibility by construction
The compiler’s output depends only on the graph’s nodes, edges and normalised parameters, emitted in a deterministic dependency order. Canvas layout and display names never reach the code. The same strategy therefore always compiles to byte-identical Python, and the code’s SHA-256 hash identifies exactly what was executed.
lines += ["", "def run(ctx: Run) -> None:"]
for node_id in topological_order(doc):
    node = nodes[node_id]
    params = ops[node_id].params.model_validate(node.params).model_dump(mode="json")
    inputs = ", ".join(f"{port!r}: {src.node}[{src.port!r}]" for port, src in sorted(wiring[node_id].items()))
    lines.append(f"    {node_id} = ctx.op({node_id!r}, {node.operator!r}, {node.version}, {{{inputs}}}, {params!r})")
return "\n".join(lines) + "\n"The studio, the command line and export all pass through one compile-and-check gate, so they accept and refuse the same strategies. Generated code is readable on purpose: the studio shows it alongside each strategy, and exported code can be reviewed without the studio.
Research discipline
Lookahead bias is tested directly. Operator contract tests rewrite later data and check that earlier outputs do not change, and deliberately leaky operators confirm that those tests catch a leak when one exists.
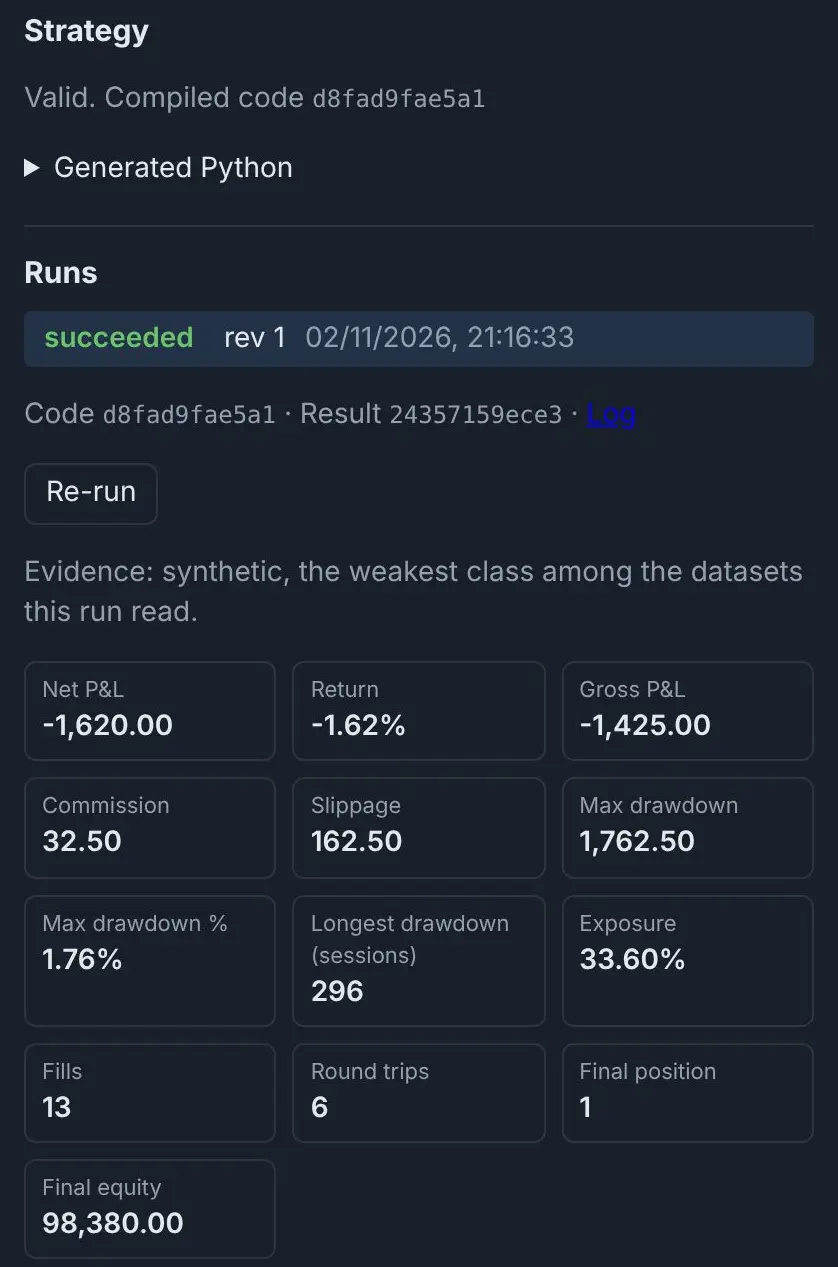
Each run records the compiled-code and result identifiers and labels the weakest class of evidence among the datasets it read, so a result built on synthetic data says so. An analysis-method registry organises descriptive, inference, selection and robustness methods for evaluating results.
Architecture
- Editor
- React graph editor
- Local service
- Local API and queue
- Validated graph compiler
- Execution
- Python worker
- Versioned datasets
- NautilusTrader simulation
- Outputs
- Results and provenance
- Standalone Python bundle
Compiling to ordinary Python, rather than interpreting the graph at run time, keeps one artefact at the centre: what the worker runs, what export produces and what the hash identifies are the same code.
Testing and limits
The project’s latest verification report records a local Linux gate, 36 mutations caught by the test suite, and research and leakage checks. These are the project’s recorded results, not a run performed for this site.
- macOS and hosted verification remain outstanding. The hosted CI run for the inspected version executed no steps, so it provides no test results either way.
- Research on real, licensed market data is still to come; the captures here use synthetic data.
- The studio is a research tool. Nothing on this page is a claim of trading performance.
Status and next steps
Quant Research Studio is a working prototype. Next are hosted and cross-platform verification and a research programme on licensed data.